Personal blog and resume holder

Richmond Newman
Recent Posts

Blog now featuring interactive plots
Facebook Data Export

Nucleation of Hard Octahedra (Video)

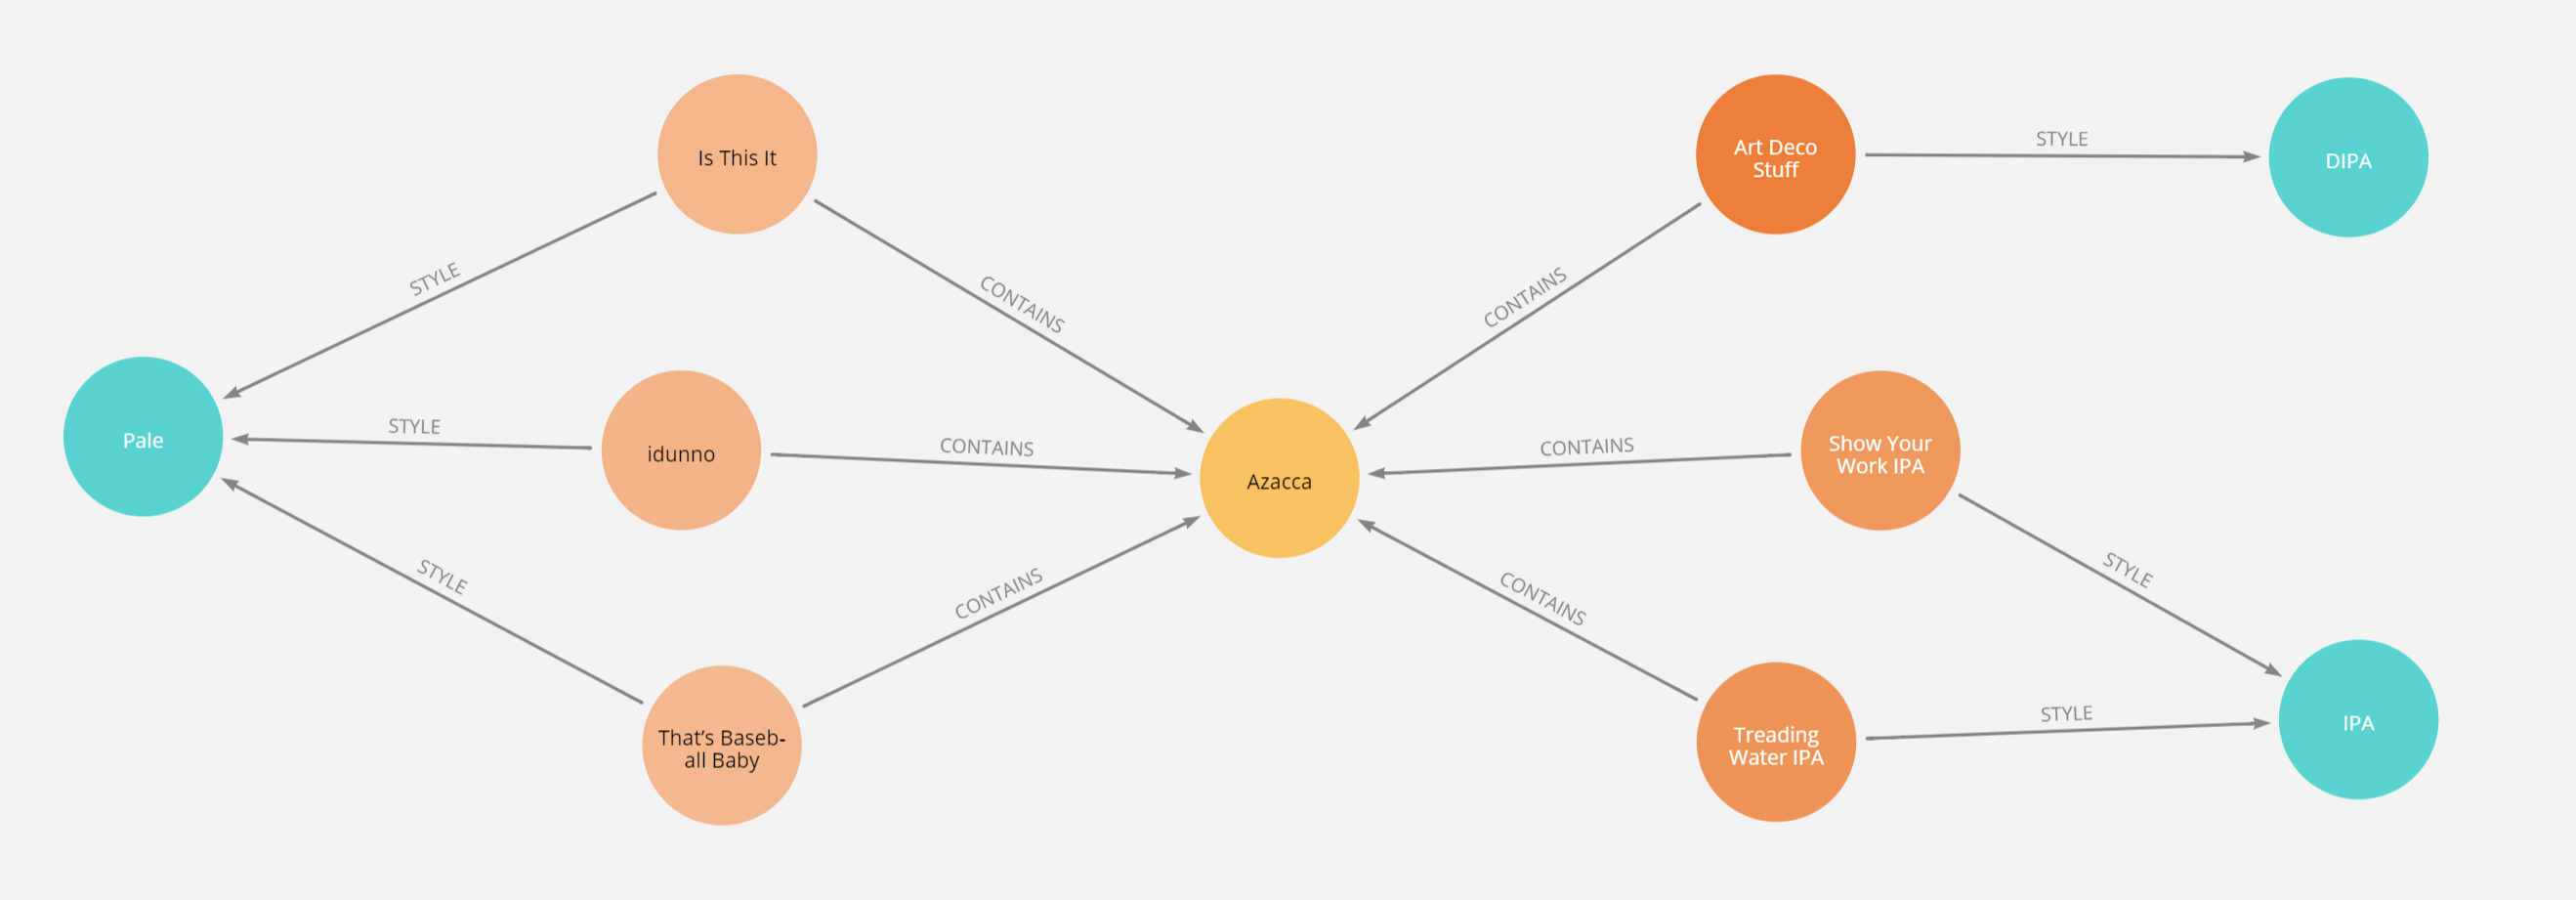
Cloudburst Brewing Beer and Hops Graph
Crystallization in Systems of Hard Polyhedra (PhD Defense Slides)

Percolation
Categories
- bikes2
- plotly2
- polyhedra2
- self-assembly2
- beer1
- berry1
- boats1
- christmas1
- clafoutis1
- coconut-milk1
- cooking1
- dessert1
- dissertation1
- doctoral-defense1
- facebook1
- hops1
- json1
- katex1
- manuals1
- merlin1
- neo4j1
- nonlinear-dynamics1
- npm1
- octahedra1
- ode1
- percolation1
- phase-transition1
- photography1
- privacy1
- recipe1
- resume1
- social-media1
- statistical-physics1
- syntax-highlighting1
- univega1